Introduction
Application deployment is the single most common source of Intune support tickets in environments we manage. It outpaces compliance policy issues, device enrollment failures, and configuration profile conflicts by a wide margin. The reason is straightforward: app installation involves more moving parts than almost any other Intune workload. There is a download phase, a detection phase, an install phase, and another detection phase. Each one can fail independently, and the portal error message rarely tells you which one broke or why.
The typical experience goes like this. You assign an application to a group. A few hours later, the dashboard shows a handful of devices in "Failed" status. You click into the device and see an error code — something like 0x87D300C9 — that means nothing to you without a search. You look it up, find a vague Microsoft doc that says "the application was not detected after installation completed," and you are no closer to understanding what actually went wrong. Was the app installed but detection is pointing at the wrong thing? Did the installer silently fail? Did it never download in the first place?
This guide bridges that gap. It starts with what the Intune portal can tell you, moves through error code interpretation, and then goes deep into the endpoint-level logs and registry keys that reveal the actual root cause. The goal is to give you a repeatable methodology — not just a list of error codes, but a diagnostic process that works regardless of which app failed or why.
How Intune App Installation Actually Works
Before you can troubleshoot app failures effectively, you need a clear mental model of how Intune actually processes a Win32 app deployment. Most documentation describes this in abstract terms, but the sequence matters because the error code and log entries you see are direct products of which stage failed.
When you create a Win32 app in Intune and assign it to a group, nothing happens immediately on the endpoint. The device must check in with the Intune service first. During that check-in, the Intune Management Extension (IME) — a service running locally on the Windows device — polls for new or changed app assignments. If the service determines that a new app assignment applies to this device, it begins the installation lifecycle.
The lifecycle has seven distinct stages. The IME first evaluates whether the assignment applies to this device based on filters, group membership, and platform requirements. Then it downloads the encrypted .intunewin package from Microsoft's content delivery network. Once downloaded, it extracts and decrypts the package contents into a working directory. Before running the install command, it executes your detection rules as a pre-install check — if the app is already detected, it skips the install entirely. If the app is not detected, it runs your install command. After the install command completes, it runs the detection rules again to verify the install actually worked. Finally, it reports the result back to the Intune service, which updates the portal dashboard.
This sequence is critical because failures at different stages produce different error codes and different log patterns. A download failure looks nothing like a detection failure in the logs, even though both might show up as "Failed" in the portal with a similarly unhelpful error code.
EvaluationFilters & targeting
Download.intunewin from CDN
ExtractionDecrypt & unpack
DetectionAlready installed?
ExecutionRun install command
DetectionVerify success
ReportingUpdate portal
One detail that trips people up: the IME runs detection rules twice. The pre-install detection check determines whether the install should run at all. If your detection rule matches (meaning the app appears to already be present), the IME skips the install and reports "Already installed." The post-install detection check confirms the install actually succeeded. If the install command runs and exits with code 0, but the post-install detection check fails, the IME reports a failure — even though the installer itself thought it succeeded. This is the single most common class of app install failure we see in the field.
Portal-Level Troubleshooting: Where to Start
The natural starting point for any app installation issue is the Intune admin center at intune.microsoft.com. The portal cannot tell you the root cause of most failures, but it can narrow the problem to a specific device, a specific error code, and a specific point in the lifecycle. That narrows your investigation before you ever touch the endpoint.
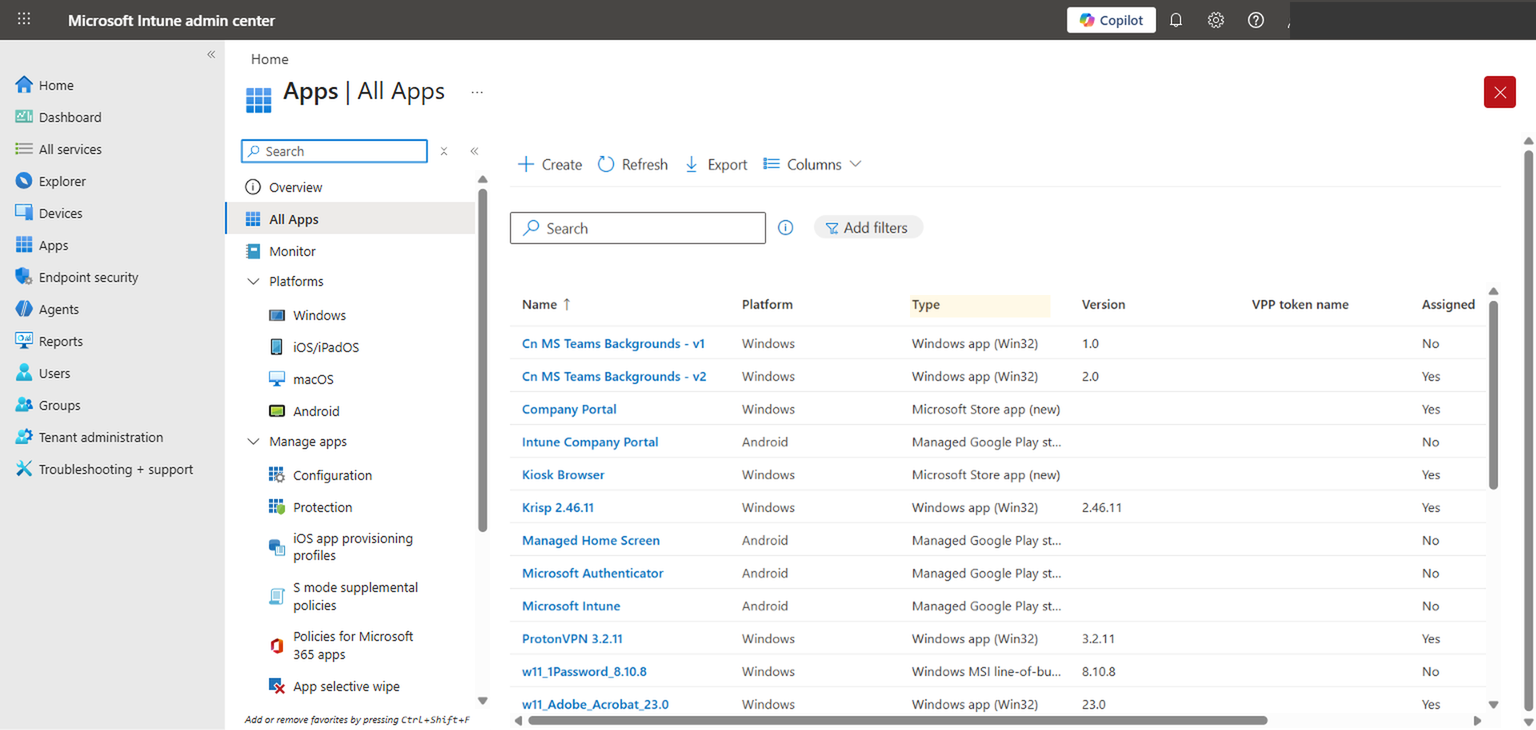
Start at Apps > All apps. This view shows every application in your tenant, along with the type designation. The type column matters because Win32 apps, MSI line-of-business apps, Microsoft Store apps, and managed Google Play apps all have different installation mechanisms and different failure modes. A Win32 app failure and a Store app failure require entirely different troubleshooting approaches, so confirm the app type before you start digging.
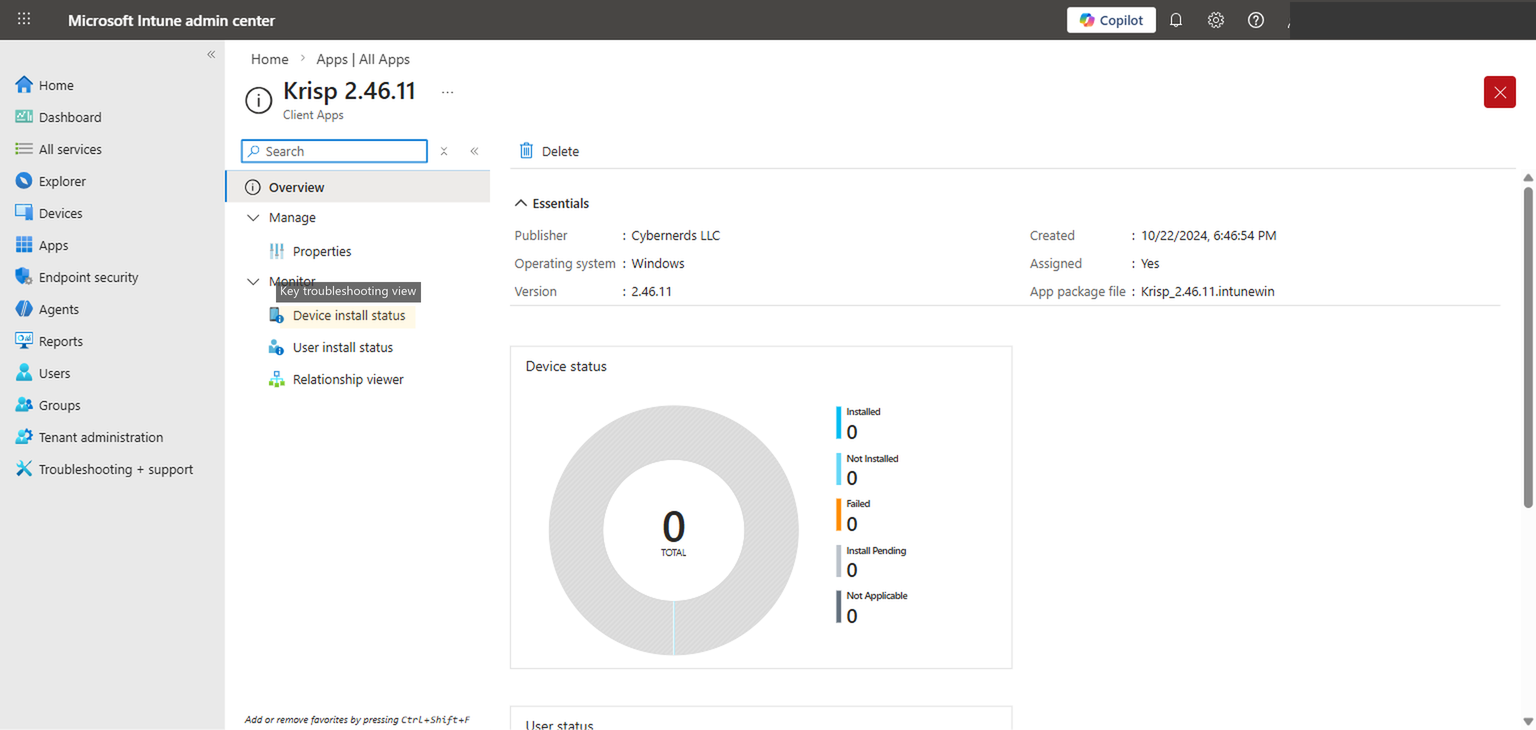
Click into the specific app that is failing. The overview page shows the essentials — publisher, version, package file name — and a device status donut chart that breaks down the deployment into five categories: Installed, Not Installed, Failed, Install Pending, and Not Applicable. Each of these categories tells you something specific.
"Failed" is obvious — the install was attempted and did not succeed. "Install Pending" means the device has received the assignment but has not yet attempted the install, usually because it has not checked in or because another install is queued ahead of it. "Not Applicable" is one of the more useful signals: it usually means the device does not meet the assignment filter criteria, or the platform requirement does not match, or the device is not in the targeted group. If you see a device in "Not Applicable" when you expect it to install, the problem is almost always in your assignment or filter configuration, not in the app itself.
The most important navigation item on this page is the Device install status link in the left sidebar. This view shows every device that has been evaluated for this app, along with the specific status, error code, and last check-in time for each one. This is where you identify which devices are failing and capture the error code you need for the next step.
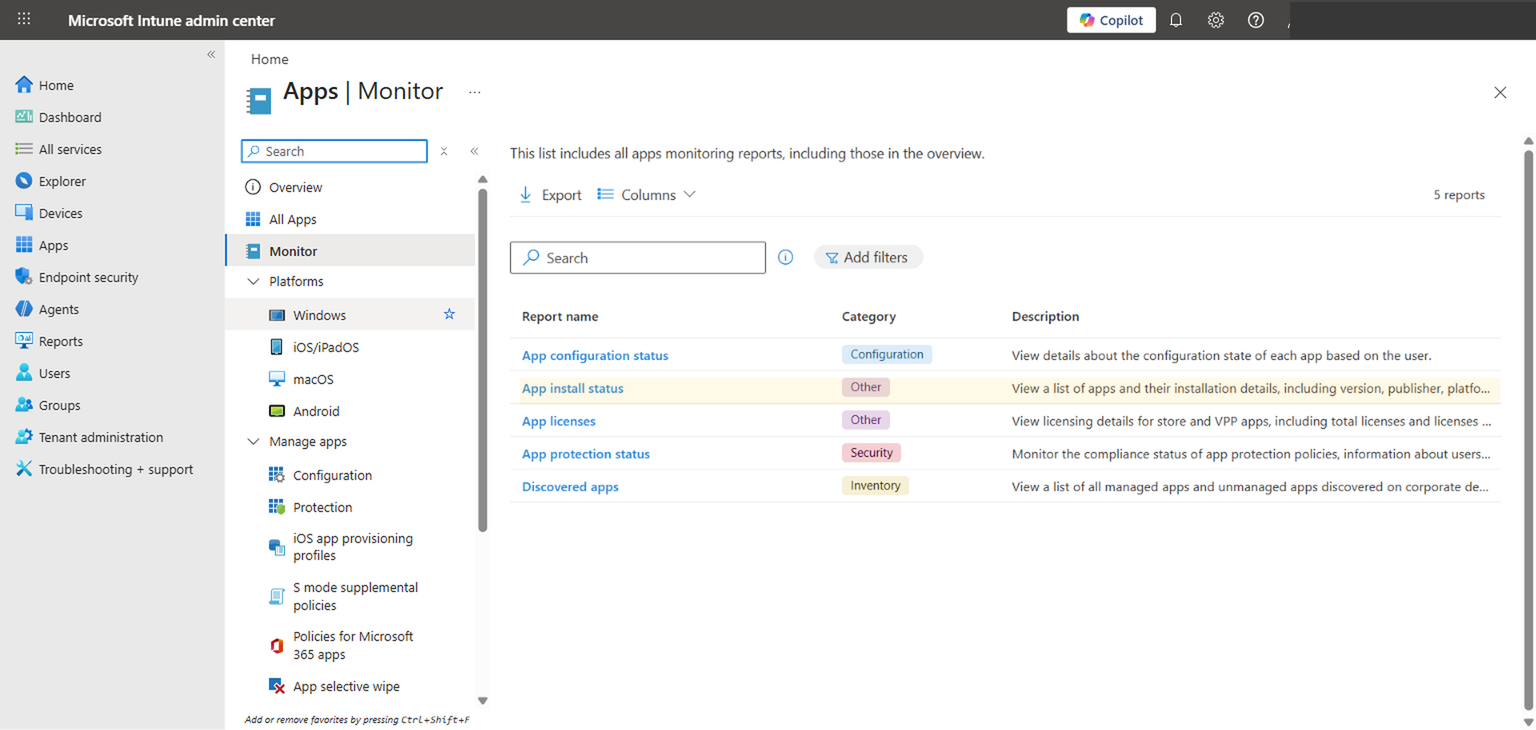
For a fleet-wide view that spans all apps rather than a single app, navigate to Apps > Monitor. This section contains several built-in reports. The App install status report is the one you want for troubleshooting. It lets you filter by app, status, and platform to find failure patterns across your entire tenant. If multiple apps are failing on the same set of devices, that points to a systemic issue — network connectivity, IME service health, or a pending reboot blocking new installs — rather than a problem with any individual app package.
Understanding Error Codes
Once you have identified a failing device and captured the error code from the portal, you need to know what that code actually means. Microsoft's documentation covers some of these, but the descriptions are often so generic that they do not help you narrow the problem. Here are the error codes we see most frequently in production environments, along with what they actually indicate and where to look first.
| Error Code | Common Name | What It Usually Means | First Thing to Check |
|---|---|---|---|
0x87D300C9 |
Not detected after install | The install command ran and exited successfully, but the post-install detection rule did not find the app. The app may have installed to a different path, a different version, or the detection rule is checking the wrong thing entirely. | Compare your detection rule path/registry key against the actual install location on a test device. |
0x87D13B9F |
Install queue collision | Another app installation was already in progress when the IME tried to start this one. The IME processes installs sequentially, not in parallel. | Check if multiple apps were assigned simultaneously. Stagger deployments or add dependencies to control install order. |
0x80070032 |
Request not supported | Typically an architecture mismatch or an unsupported install context. The install command may be trying to run a 64-bit installer in a 32-bit context, or the install context (System vs. User) does not match what the installer expects. | Verify the "Install behavior" setting matches the installer's requirements. Check "Install command" for 64-bit path assumptions. |
0x87D1041C |
Application not detected | Similar to 0x87D300C9 but can also appear during required app compliance checks. The app is supposed to be present but the detection rule cannot find it. May indicate the app was uninstalled by a user or removed by another process. |
Run the detection rule manually on the device. Confirm the app is still installed and the detection artifact exists. |
0x87D101F8 |
Unspecified error | The IME could not categorize the failure. This is the catch-all code and it means the portal cannot help you further. You must go to the endpoint. | Open the IME log on the affected device and search for the app ID. The log will contain the actual failure detail. |
0x8018002B |
Device already enrolled | An enrollment-related condition is preventing app processing. Sometimes appears when a device re-enrolls or when enrollment state is inconsistent. | Verify the device enrollment status in Intune. Consider syncing or re-enrolling the device if the state is stale. |
Portal error codes identify the symptom, not the root cause. A code like 0x87D300C9 tells you that detection failed after install, but it does not tell you whether the detection rule is wrong, the installer put files in an unexpected location, or the installer silently failed despite returning exit code 0. For the root cause, you need endpoint logs.
One pattern worth noting: if you see the same error code across many devices for the same app, the problem is almost certainly in the app configuration — the detection rule, the install command, or the return code mapping. If you see different error codes across devices for the same app, you are likely dealing with environmental variation: different OS versions, different disk space situations, different network conditions, or conflicting software.
The Troubleshooting + Support Blade
There is a diagnostic tool built into the Intune admin center that most administrators never use, or use only when directed to by Microsoft support. Navigate to Troubleshooting + support in the left navigation of the admin center. This blade gives you a user-centric view of everything Intune knows about a specific user's devices, policies, apps, and enrollment state.
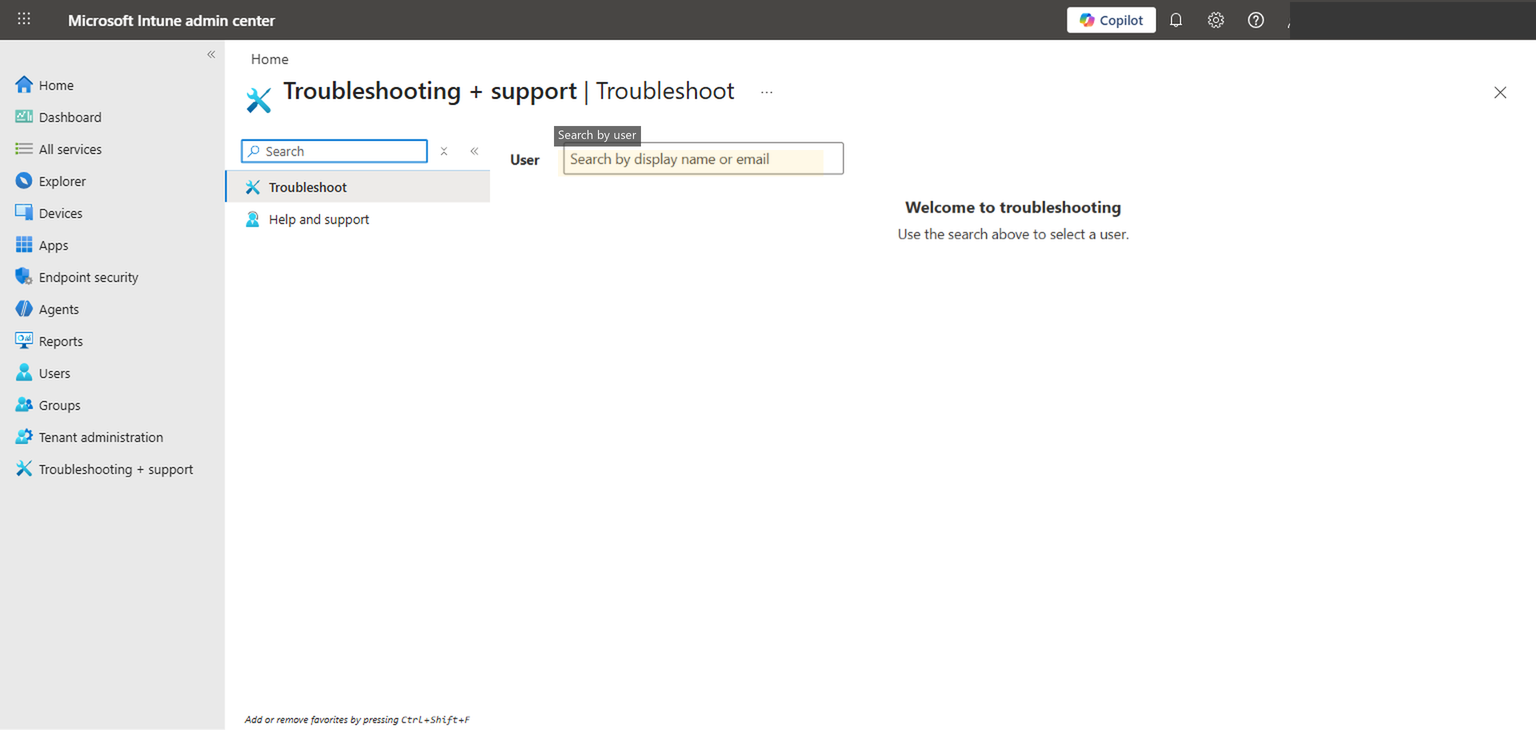
To use it, type a user's name or UPN into the search field. Once you select a user, the page populates with their enrolled devices and a tabbed interface showing different categories of information. The Managed Apps tab is the relevant one for app troubleshooting. It shows every app assigned to that user (through user-targeted assignments), along with the install status and error details for each device. The Managed Devices tab shows device-targeted assignments.
The advantage of this view over the per-app device install status is context. When you are troubleshooting from the app blade, you see one app across many devices. When you troubleshoot from the user blade, you see all apps for one user across their devices. This matters when the problem is not a single app failure but a broader issue — maybe the user's device has not checked in recently, maybe enrollment is unhealthy, maybe multiple apps are all failing on the same device. The user-centric view surfaces those patterns immediately.
This blade also shows more granular status details than the app-level view in some cases. You can see the last sync time for each device, the enrollment status, and whether the device is compliant. If a device shows "last sync" from three days ago, you know the app failure is not a packaging problem — the device simply has not checked in to receive the assignment.
Deep Dive: Endpoint-Level Troubleshooting
The portal can tell you that something failed and give you an error code. The endpoint tells you exactly what happened, in what order, and why. If you have exhausted the portal-level diagnostics and still do not know the root cause, the answer is on the device. Every app installation attempt is logged in detail.
The Intune Management Extension Log
This is the primary diagnostic artifact for Win32 app installations. The IME writes a detailed log of every action it takes, including policy evaluation, content download, detection rule execution, install command execution, exit codes, and status reporting.
The log file lives at:
C:\ProgramData\Microsoft\IntuneManagementExtension\Logs\IntuneManagementExtension.log
C:\ProgramData\Microsoft\IntuneManagementExtension\Logs\AppWorkload.log
The primary log is IntuneManagementExtension.log. The AppWorkload.log contains more focused Win32 app deployment data — check-ins, install actions, applicability results, and detection outcomes. Both are plain text, typically several megabytes, and log activity for all IME-managed workloads. You do not read them top to bottom. You search them. Use CMTrace.exe (from the Configuration Manager toolkit) if you have it — it makes log parsing significantly easier with real-time filtering and timestamp highlighting.
Two other paths are useful when diagnosing download or extraction failures. The encrypted content downloads to C:\Program Files (x86)\Microsoft Intune Management Extension\Content\Incoming\, and the decrypted package stages to C:\Windows\IMECache\ before the installer executes. If either directory is missing or empty when it should contain data, you have a download or extraction failure.
The most effective approach is to get the app ID from the Intune portal (visible in the URL when you navigate to the app, or in the app's Properties page) and search the IME log for that GUID. Every log entry related to that app will reference the same ID, so you can trace the full lifecycle of a single installation attempt from policy receipt through status reporting.
Here are the key log entries to search for, in the order they appear during a normal installation attempt:
"Get policies" — This entry appears when the IME checks in with the Intune service and receives its list of app assignments. If you do not see a "Get policies" entry within the expected check-in window (default is every 8 hours, or triggered by a manual sync), the device is not communicating with the service. Check network connectivity, proxy configuration, and the IME service status.
"ContentManager" — These entries trace the download of the .intunewin package. You will see entries showing download initiation, progress, and completion. If the download stalls or fails, the log will show HTTP errors, timeout messages, or retry attempts. Common causes include proxy servers that block or inspect the Microsoft content CDN URLs, firewall rules that interfere with large downloads, or disk space exhaustion in the staging directory.
"Applicability" — This is the pre-install detection rule evaluation. The log will show which detection method was used (file, registry, or MSI product code), what value was expected, and what value was found. If the detection rule matches at this stage, the IME skips the install and logs "Application is already installed." If you see this when the app is not actually installed, your detection rule is matching something it should not — perhaps a leftover registry key from a previous version, or a file that exists from a different product.
"Start install" and "ExitCode" — These entries bracket the actual installation. "Start install" shows the exact command line that the IME executed, which is invaluable for verifying that your install command is correct. "ExitCode" shows what the installer returned. An exit code of 0 means the installer reported success. An exit code of 1603 means the MSI install failed (check for locked files, missing prerequisites, or insufficient permissions). An exit code of 3010 means the install succeeded but a reboot is required. If you have not mapped 3010 as a success code in your Intune app configuration, the IME will treat it as a failure.
"Detection" — The post-install detection check. The log shows the detection method, the expected value, and the actual value found on the device. If detection fails here, the app installed (or the installer claimed it did) but the detection rule cannot confirm it. This is the most common root cause of the 0x87D300C9 error code, and the log entry will tell you exactly what the detection rule looked for and what it found instead.
To find the app ID, navigate to the app in the Intune portal and look at the URL. It will contain a GUID like a1b2c3d4-e5f6-7890-abcd-ef1234567890. Search the IME log for this exact string. Every lifecycle event for that app on that device will reference this ID.
Event Viewer
The Windows Event Viewer contains MDM-related events that can supplement the IME log, particularly for enrollment-related app failures or cases where the IME service itself is unhealthy.
Navigate to Applications and Services Logs > Microsoft > Windows > DeviceManagement-Enterprise-Diagnostics-Provider > Admin. This log captures MDM policy application events, sync events, and enrollment state changes.
The most useful events for app troubleshooting are in the 800-899 range, which cover MDM session establishment, policy download, and policy application. If you see errors in this range around the same time as your app failure, the problem may be at the MDM session level rather than the app level. Event IDs in the 400 range relate to enrollment state — useful if you suspect the device's enrollment is unhealthy.
The Event Viewer is not the first place to look for app install failures, but it becomes important when the IME log suggests that the device is not receiving policies at all, or when the error code points to an enrollment-related issue like 0x8018002B.
Registry
The IME stores its internal state for each app in the registry. This is useful when you want to understand what the IME believes the current install state is, separate from what is actually true on the device.
Navigate to:
HKLM\SOFTWARE\Microsoft\IntuneManagementExtension\Win32Apps\{UserSID}\{AppID}Under each app ID subkey, the Result value contains a JSON blob that describes the last installation attempt — the exit code, the enforcement state, the detection result, and timestamps. The GRS (Global Reinstatement Status) subkey controls whether the IME will retry the installation on the next check-in.
The registry is particularly useful in two scenarios. First, when the portal shows a failure but the device seems to have the app installed correctly, checking the registry tells you whether the IME is aware of the successful install or is still holding a stale failure state. Second, when you need to force a reinstall of an app, deleting the app's registry subkey under the user's SID and restarting the IME service will cause it to re-evaluate the app on the next check-in.
Deleting IME registry keys forces re-evaluation of app assignments, which can trigger unexpected reinstalls or removals. Use this technique only on specific devices where you understand the consequences, not as a fleet-wide troubleshooting step.
MDM Diagnostics Tool
When you need to collect all relevant diagnostic data from a device — either for your own analysis or to send to Microsoft support — the built-in MDM diagnostics tool packages everything into a single CAB file.
Run the following from an elevated command prompt:
mdmdiagnosticstool.exe -area DeviceEnrollment;DeviceProvisioning;Autopilot -cab C:\temp\intune-diag.cabThis collects the IME logs, event logs, registry exports, enrollment state, and other diagnostic artifacts into one compressed archive. The tool is already present on any Windows 10/11 device that is MDM-enrolled. The output is useful for offline analysis and is the standard format that Microsoft support requests when you open a case.
For app-specific troubleshooting, the CAB file contains the same IME log you would read manually, but it also includes additional context like the MDM enrollment state, certificate information, and policy metadata that can help diagnose systemic issues.
Common Failure Patterns and How to Fix Them
After troubleshooting hundreds of app deployment failures across different tenants, certain patterns appear repeatedly. These are the issues we see most often, along with the fix for each one.
This is the most common cause of 0x87D300C9 ("not detected after install"). The installer puts files in one location; the detection rule checks a different location. The classic version of this problem involves 32-bit applications on 64-bit Windows. If your detection rule checks C:\Program Files\AppName\app.exe but the installer is a 32-bit MSI that defaults to C:\Program Files (x86)\AppName\app.exe, detection will fail every time. Similarly, if you use MSI product code detection but the new version of the app has a different product code than the one you configured, detection will never match. The fix is to install the app manually on a clean test device, confirm the exact file paths, registry keys, or product codes that are created, and set your detection rules to match those exact artifacts.
Many installers return non-zero exit codes for conditions that are not actually failures. The most common example is exit code 3010, which means "success, reboot required." If you have not explicitly mapped 3010 as a success return code in your Intune app configuration, the IME interprets it as a failure and reports it as such. Some installers also use exit code 1641 (success, reboot initiated) or custom codes. Check the vendor's documentation for the installer's return code table, and add every expected success code to the return code configuration in Intune.
The .intunewin package is downloaded from Microsoft's content delivery network. If your network has a proxy server, a web filter, or a firewall that inspects or blocks traffic to *.manage.microsoft.com or the Azure CDN endpoints, the download may fail or time out. The IME log will show ContentManager errors with HTTP status codes. This is particularly common in environments with SSL inspection, where the proxy's certificate is not trusted by the device, causing the TLS handshake to fail. The fix is to ensure the required Intune endpoints are excluded from SSL inspection and allowed through your firewall.
If App B depends on App A (for example, a plugin that requires the host application), and both are assigned to a device at the same time, the IME may attempt to install App B before App A has completed. Intune supports dependency chains — you configure them in the app's Properties under Dependencies. If you have not configured dependencies, the IME installs apps in an arbitrary order. Similarly, supersedence relationships (where a new app version replaces an old one) must be configured explicitly. If the old version is still assigned alongside the new version without a supersedence relationship, the IME may attempt conflicting installations.
When you configure a Win32 app in Intune, you specify whether it should install in "System" context or "User" context. System context runs as SYSTEM (session 0), which is appropriate for most per-machine installations. User context runs as the logged-in user, which is needed for per-user installations. If an installer expects to run as the logged-in user (to access the user profile, HKCU registry, or user-specific paths) but you configure it to run as System, it may install to the wrong profile or fail entirely. Conversely, an MSI that writes to HKLM or Program Files will fail if run in user context without elevation. Match the install behavior to the installer's requirements.
This is a variation of the detection rule mismatch, but it deserves its own callout because the symptom is confusing. The app is genuinely installed and functional on the device, but the IME reports it as failed because the detection rule is checking an artifact that does not exist. For example, you configure file detection to look for app.exe in a specific directory, but the installer names the executable AppLauncher.exe. Or you configure registry detection for a value that only gets created after the app is launched for the first time, not during installation. Test your detection rule on a device that has the app installed and on a device that does not. It should return true on the first and false on the second. If it returns false on both, your detection rule is wrong.
Practical Troubleshooting Workflow
When an app install failure is reported, this is the sequence we follow. It starts at the portal, escalates to the endpoint only when needed, and focuses on the most common root causes first.
Step 1: Check the portal. Navigate to the failing app in Intune, open the Device install status view, and identify which devices are failing. Note the error code and the last check-in time for each failing device. If the device has not checked in recently, the problem may resolve itself on the next sync.
Step 2: Read the error code. Look up the error code using the table in this article or Microsoft's documentation. Determine which stage of the lifecycle the error corresponds to — download, detection, install, or reporting. This tells you where to focus your investigation.
Step 3: Check for patterns. Are all devices failing with the same code? That points to a configuration issue (detection rule, install command, return codes). Are different devices failing with different codes? That points to environmental issues (network, disk space, conflicting software).
Step 4: If the error is generic, go to the endpoint. Error codes like 0x87D101F8 (unspecified) cannot be diagnosed from the portal. You need the IME log on the affected device.
Step 5: Open the IME log. Navigate to C:\ProgramData\Microsoft\IntuneManagementExtension\Logs\ and open IntuneManagementExtension.log. Search for the app ID (the GUID from the portal URL).
Step 6: Trace the lifecycle. Starting from the most recent policy evaluation for that app ID, read through the log entries in order. Identify whether the download succeeded, whether the pre-install detection ran correctly, whether the install command executed, what exit code it returned, and whether the post-install detection passed or failed.
Step 7: If the install succeeded but detection failed, fix the detection rule. This is the single most common resolution. The IME log will show you exactly what the detection rule looked for and what it found. Compare that against the actual state of the device after installation.
Step 8: If the install command failed, investigate the exit code. Look up the exit code in the installer vendor's documentation. Common exit codes include 1603 (MSI fatal error), 1618 (another install in progress), 1619 (package could not be opened), and 3010 (success, reboot needed). Each one has a specific fix.
Most investigations resolve at step 2 or step 7. The error code points you to a detection or return code issue, you fix the configuration, and the next device sync picks up the change. Endpoint-level log analysis is necessary in maybe 20% of cases, but when you need it, it is the only path to the answer.
Prevention: Getting App Packaging Right the First Time
The most efficient way to handle app install failures is to prevent them. Most failures we encounter are avoidable with disciplined packaging and testing practices. None of what follows is complicated, but it is frequently skipped under time pressure, and the result is a flood of support tickets two days after deployment.
Before deploying any Win32 app through Intune, test the install command manually on a clean device running in the same context the IME will use. If the app is configured to install as System, open a SYSTEM-level command prompt (using psexec -s cmd or a similar tool) and run the exact install command you configured in Intune. Verify that it completes without errors, that the expected files are created in the expected locations, and that the exit code is 0 (or another expected success code). If the install fails or behaves differently in System context than it does when you double-click the installer, you have found the problem before it reaches your users.
Use the IntuneWinAppUtil.exe packaging tool correctly. Specify the source folder, the setup file, and the output folder. The tool creates the encrypted .intunewin package that Intune expects. A common mistake is packaging the wrong directory (including extra files that inflate the package size and slow downloads) or pointing to the wrong setup file (causing the install command to fail because the expected executable is not where the IME expects it).
Test detection rules against two states: a clean device where the app has never been installed, and a device where the app is currently installed. The detection rule should return false on the clean device and true on the installed device. If it returns true on the clean device, you will get false "already installed" results. If it returns false on the installed device, every install will be reported as a failure. Both scenarios are common enough that testing against both states should be standard practice.
Map all expected return codes explicitly. At minimum, map exit code 3010 as a "soft reboot" return code for any MSI-based installer. If the vendor documents additional success codes, map those as well. Leaving the return code configuration at default means anything other than 0 is treated as a failure, which is correct for most installers but wrong for enough of them to cause problems at scale.
Finally, document your dependencies and install order. If App C requires App B, which requires App A, those dependencies must be configured in Intune so the IME installs them in the correct sequence. Relying on timing or manual sequencing is fragile. Configure it explicitly and test the full chain on a clean device.
Final Takeaways
The pattern across hundreds of app deployment failures is remarkably consistent. The majority are detection rule problems or packaging problems, not Intune platform bugs. The installer runs, does its work, and the IME cannot confirm the result because the detection rule is pointing at the wrong artifact. The fix takes five minutes once you know what to change, but finding the root cause can take hours if you do not have a systematic approach.
The Intune portal gets you to the symptom: which devices failed, what error code was returned, and roughly which lifecycle stage broke. The IME log on the endpoint gets you to the cause: what command was executed, what it returned, what the detection rule expected, and what it actually found. The workflow in this article — portal first, error code second, endpoint only when needed — is designed to minimize the time between "something failed" and "here is the fix."
If your team is spending significant time on recurring app deployment issues, or if you are planning a large-scale application migration to Intune and want to avoid the common pitfalls, that is the kind of work where having someone who has already debugged these failures at scale can save real time. Cybernerds works with organizations at every stage of Intune maturity, from first deployment to fleet-wide optimization.